Overview Research Facilities Team Data News Publications Contact
The CALCE battery team is open to collaborate with research groups and companies around the world. We provide open access to our experimental test data on lithium-ion batteries, which includes continuous full and partial cycling, storage, dynamic driving profiles, open circuit voltage measurements, and impedance measurements. Battery form factors include cylindrical, pouch, and prismatic, and the chemistries include LCO, LFP, and NMC. The data from these tests can be used for battery state estimation, remaining useful life prediction, accelerated battery degradation modeling, and reliability analysis. A description of each battery and each test is presented below. Use of this data for publication purposes should include references to the CALCE article(s) that describe the experiments conducted to generating the data. If you have questions or are interested to contribute your data to the battery data collective, please contact Prof. Michael Pecht.
Table of Contents
| INR 18650-20R Battery | A123 Battery | CS2 Battery | CX2 Battery | PL Sample | Storage Data & Test Description |
|---|
Data Description
Cylindrical Cells
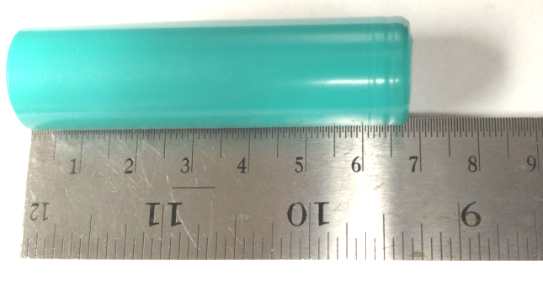
| Battery (Parameters) | Specifications (Value) |
| Capacity Rating | 2000 mAh |
| Cell Chemistry | LiNiMnCo/Graphite |
| Weight (w/o safety circuit) | 45 g |
| Diameter | 18.33 mm ± 0.07 mm |
| Length | 64.85 mm ± 0.15 mm |
| Special Notes | Tab length not included in the dimensions |

Data and Test Description
Battery state of charge (SOC) estimation is a crucial function of battery management systems (BMSs), since accurate estimated SOC is critical to ensure the safety and reliability of electric vehicles. A widely used technique for SOC estimation is based on online inference of battery open circuit voltage (OCV). Low-current OCV and Incremental-current OCV tests are two common methods to observe the OCV-SOC relationship, which is an important element of the SOC estimation technique.
We conducted an experiment where these two OCV tests are run at three different temperatures and based on which, two SOC estimators are compared and evaluated in terms of tracking accuracy, convergence time, and robustness. In addition, four dynamic tests are presented, one for estimator parameter identification and the other three for estimator performance evaluation.
The comparison results show that estimator 2(based on the incremental OCV test) has higher tracking accuracy and is more robust against varied loading conditions and different initial values of SOC than estimator 1 (based on the lowcurrent OCV test) with regard to ambient temperature. Therefore, the incremental OCV test is recommended for predetermining the OCV-SOCs for battery SOC online estimation in BMSs. The data for the tests performed is available below for download.

Low Current OCV
The Low-current OCV test used a small current (e.g. C/20, C/25) to charge and discharge the battery so that the corresponding terminal voltage is an approximation of OCV. The test execution steps are:
- Charge battery fully to 100% SOC
- Now discharge using a negative pulse current relaxation duration at every 10% SOC
- Charge again following the same routine but with a positive pulse current
- Apply Averaging and Linear Interpolation step to obtain the OCV-SOC
curve at 0°C, 25°C and 45°C.
| Sample 1 | Initial Capacity Data | Data for 0°C | Data for 25°C | Data for 45°C |
| Sample 2 | Initial Capacity Data | Data for 0°C | Data for 25°C | Data for 45°C |

Incremental Current OCV
The Incremental OCV test consisted of many SOC intervals and rest periods after which the OCV with the corresponding SOC were observed. Additional data points for the OCV curve were obtained within the SOC intervals using interpolation methods. The test execution steps are:
- Charge battery to cut-off voltage of 4.2V at constant current of 1C-rate
- Charge at constant voltage until its current is reduced to 0.01C
- Now Discharge at constant rate of C/20 until the voltage drops to 2.5V
- Fully Charge at constant rate of C/20 to 4.2V
- Average voltage of charging and discharging process recorded as OCV at 0°C, 25°C and 45°C.
| Sample 1 | Initial Capacity Data | Data for 0°C | Data for 25°C | Data for 45°C |
| Sample 2 | Initial Capacity Data | Data for 0°C | Data for 25°C | Data for 45°C |

Dynamic Test Profile
This test consists of different dynamic current profiles like Dynamic stress test DST , Federal Urban Driving Schedule FUDS, US06 Highway Driving Schedule and Beijing Dynamic Stress Test BJDST.
All tests were performed for 80% battery level and 50% battery level at 0°C, 25°C and 45°C.
The above data files have been referenced in
[1] Influence of different open circuit voltage tests on state of charge online estimation for lithium-ion batteries.
Fangdan Zheng, Yinjiao Xing, Jiuchun Jiang, Bingxiang Sun, Jonghoon Kim, Michael Pecht, Applied Energy, 183, pp.513–525, 2016.
[2] State of Charge Estimation of Lithium-Ion Batteries Using the Open-Circuit Voltage at Various Ambient Temperatures.
Yinjiao Xing, Wei He, Michael Pecht and Kwok Leung Tsui, Applied Energy, 113, pp.106-115, 2014.
[3] State of Charge Estimation for Li-Ion Batteries Using Neural Network Modeling and Unscented Kalman Filter-based Error Cancellation.
Wei He, Nicholas Williard, Chaochao Chen, Michael Pecht , International Journal of Electrical Power & Energy Systems, 62, pp.783-791, 2014.
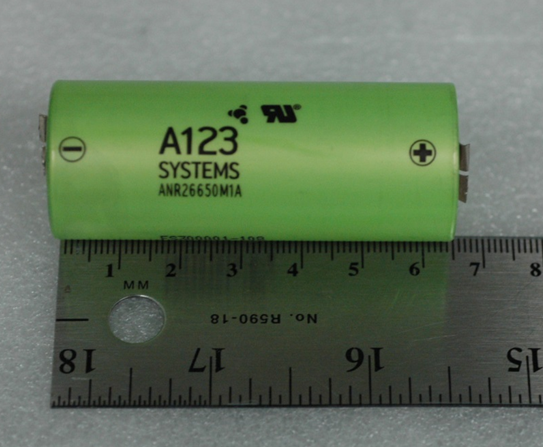
| Battery (Parameters) | Specifications (Value) |
| Capacity Rating | 1110 mAh |
| Cell Chemistry | LiFePO4 |
| Weight (w/o safety circuit) | 76 g |
| Diameter | 25.4 mm |
| Length | 65 mm |
| Special Notes | Tab length not included in dimensions |

Data and Test Description
Ambient temperature is a significant factor that influences the accuracy of battery SOC estimation, critical for remaining driving range prediction of electric vehicles (EVs) and optimal charge/discharge control of batteries. A widely used method to estimate SOC is open-circuit voltage (OCV). However, the fact that the OCV–SOC is dependent on ambient temperature and can result in errors in battery SOC estimation. To address this problem we conducted an experiment with A123 cell wherein we used two dynamic tests: Dynamic stress test (DST) and the Federal urban driving schedule(FUDS), former to identify the model parameters while later to validate the performance of the SOC estimation. The test was performed as listed below:
- Run two dynamic charge discharge test: DST and FUDS for temperature ranging from 0°C to 50°C with interval of 10°C.
- Run Low Current OCV-SOC test for temperature ranging from 0°C to 50°C with interval of 10°C.
- Develop an estimation method for OCV-SOC using model created from DST test results.
- Validate the estimation method with FUDS test results.
The data used in the experiment is available below for download.
Low-Current OCV Files:
| Data for -10°C | Data for 0°C | Data for 10°C | Data for 20°C |
| Data for 25°C | Data for 30°C | Data for 40°C | Data for 50°C |
Dynamic Profile Files:
| Data for -10°C | Data for 0°C | Data for 10°C | Data for 20°C |
| Data for 25°C | Data for 30°C | Data for 40°C | Data for 50°C |
The above data files have been referenced in:
[1] State of Charge Estimation of Lithium-Ion Batteries Using the Open-Circuit Voltage at Various Ambient Temperatures.
Yinjiao Xing, Wei He, Michael Pecht and Kwok Leung Tsui, Applied Energy, 113, pp.106-115, 2014.
[2] State of Charge Estimation for Li-Ion Batteries Using Neural Network Modeling and Unscented Kalman Filter-based Error Cancellation.
Wei He, Nicholas Williard, Chaochao Chen, Michael Pecht , International Journal of Electrical Power & Energy Systems, 62, pp.783-791, 2014.
Prismatic Cells
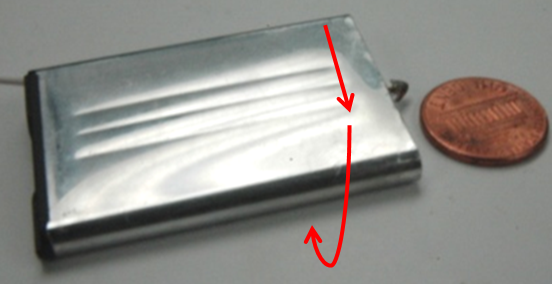
| Battery (Parameters) | Specifications (Value) |
| Capacity Rating | 1100 mAh |
| Cell Chemistry | LiCoO2 cathode, EDS results also showed trace elements of Manganese |
| Weight (w/o safety circuit) | 21.1 g |
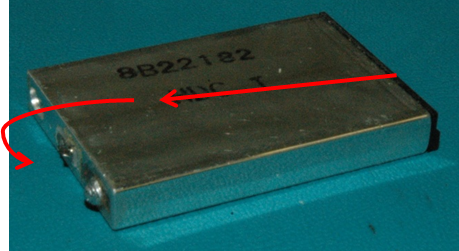
| Dimensions | 5.4 x 33.6 x 50.6 mm |
| Special Notes | Jellyroll configuration wrapped around the "length" axis, indicated by red arrows below |
Data and Test Description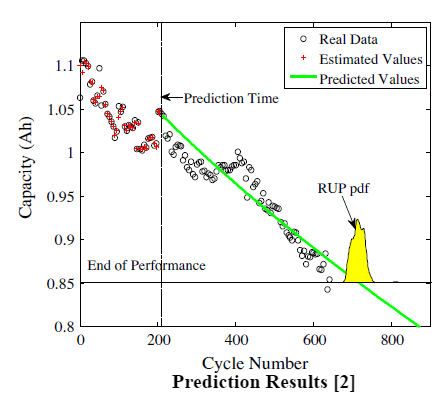
All CS2 cells underwent the same charging profile which was a standard constant current/constant voltage protocol with a constant current rate of 0.5°C until the voltage reached 4.2V and then 4.2V was sustained until the charging current dropped to below 0.05A. Unless specified, the discharge cut off voltage for these batteries was 2.7V. All the CS2 cells were randomly numbered and named accordingly. Name 'CS2_n' was given for the nth numbered CS2 cell.
Each CS2 cell was cycled multiple times under the conditions mentioned adjacent to its name in the table below. The data files for each cell contain a collection of excel files of logged data generated from its testing. These excel files were named according to the testing dates. All cells except CS2_8 and CS2_21 were tested using the Arbin Battery Tester. CS2_8 and CS_21 were tested using CADEX Battery Tester and hence data files for these cells are in .txt format and is available below for download.
Type 1 - Cycled at constant current of 0.5°C:
| CS2-8 | CS2-21 | CS2-33 | CS2-34 |
Type 2 - Cycled at constant current of 1°C:
| CS2-35 | CS2-36 | CS2-37 | CS2-38 |
Type 3 - Cycled at constant current discharge. Each cycle the discharge current was alternated between 0.11, 0.22, 0.55, 1.1, 1.65 and 2.2 Amps:
| CS2-3 | CS2-9 |
Type 4 - Cycled at a constant current discharge of 0.55A. The cut-off voltage was changed at random times to simulate a users uncertain cut-off voltage behavior:
| CS2-7 |
Type 5 - For each file, the battery was first fully charged and then fully discharged at 0.22A. Then the battery was cycled between 3.77V and 2.7V with a 0.55A discharge current in order to cycle the battery in a low regime partial charge/discharge cycle:
| CS2-5 | CS2-6 |
Type 6 - For each file, the battery was first fully charged and then fully discharged at 0.22A. Then the battery was cycled between 4.2V and 3.77V with a 0.55A discharge current in order to cycle the battery in a high regime partial charge/discharge cycle:
| CS2-24 | CS2-25 |
The above data files have been referenced in:
[1] Prognostics of lithium-ion batteries based on Dempster–Shafer theory and the Bayesian Monte Carlo method.
Wei He, Nicholas Williard, Michael Osterman, Michael Pecht, Journal of Power Sources, 196(23), pp.10314-10321, 2011.
[2] An Ensemble Model for Predicting the Remaining Useful Performance of Lithium-ion Batteries.
Yinjiao Xing, Eden Ma, Kwok Leung Tsui, Michael Pecht, Microelectronics Reliability, 53(6), pp.811-820, 2013.
[3] Comparative Analysis of Features for Determining State of Health in Lithium-Ion Batteries.
Nick Williard, Wei He, Michael Osterman, and Michael Pecht, International Journal of Prognostics and Health Management, 4, pp.1-7, 2013.
| Battery (Parameters) | Specifications (Value) |
| Capacity Rating | 1350 mAh |
| Cell Chemistry | LiCoO2 cathode (EDS showed trace elements of Manganese) |
| Weight (w/o safety circuit) | 28g |
| Dimensions | 6.6 x 33.8 x 50 mm |
| Special Notes | Jellyroll configuration wrapped around the "width" axis |
Data and Test Description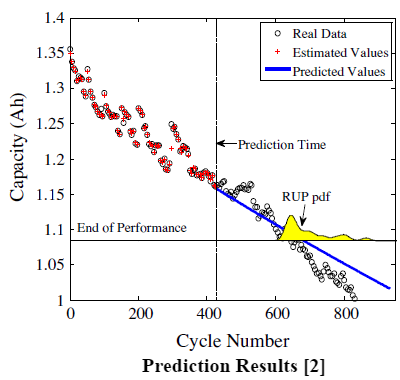
All CX2 cells underwent the same charging profile which was a standard constant current/constant voltage protocol with a constant current rate of 0.5°C until the voltage reached 4.2V and then 4.2V was sustained until the charging current dropped to below 0.05A. Some minor variations were incorporated in this standard charging profile for some of the CX2 cells mentiond below. Unless specified, the discharge cut off voltage for these batteries was 2.7V. All the CX2 cells were randomly numbered and named accordingly. Name 'CX2_n' was given for the nth numbered CX2 cell.
Each CX2 cell was cycled multiple times under the conditions mentioned adjacent to its name in the table below. The data files for each cell contain a collection of excel files of logged data generated from its testing. These excel files were named according to the testing dates. All cells except CX2_4 and CX2_31 were tested using the Arbin Battery Tester. CX2_4 and CX2_31 were tested using CADEX Battery Tester and hence data files for these cells are in .txt format. For the cell CX2_4, which was cycled at different temperatures, thermocouple data is also provided in the Temperature folder of CX2_4 data files. This data is in the .xlsx format and is available below for download.
Type 1 - Cycled at constant current of 0.5°C:
| CX2-16 | CX2-31 | CX2-33 | CX2-35 |
Type 2 - Cycled at constant current of 0.5°C:
| CX2-34 | CX2-36 | CX2-37 | CX2-38 |
Type 3 - Discharged at a constant current of 3°C:
| CX2-8 |
Type 4 - Discharged at a constant current of 0.5°C to a cut-off voltage of 2.7V. After charging the battery was discharged with a pulsed current alternating between 0.5°C and 1°C each for 30 seconds until the voltage dropped to 3.2V. A 10 seconds rest period was applied after each discharge pulse. The profile was repeated over the cycle life of the cell:
| CX2-3 |
Type 5 - Discharged at a constant current of 1C to a cut-off voltage of 2.7V. After every 10 charge/discharge cycles the ambient temperature was raised 10°C so that the cell was temperature cycled between 25°C, 35°C, 45°C and 55°C:
| CX2-4 |
Type 6 - Cycled under a pulsed discharge loading profile. First a discharge rate of 0.5°C was applied for 1 minute followed by a 5 minutes rest, and then 1°C discharge rate was applied for 1 minute followed by a 5 minutes rest and finally 2°C discharge rate was applied for 1 minute followed by a 5 minute rest. This was repeated until the cell reached its cut-off voltage:
| CX2-32 |
The above data files have been referenced in:
[1] Prognostics of lithium-ion batteries based on Dempster–Shafer theory and the Bayesian Monte Carlo method.
Wei He, Nicholas Williard, Michael Osterman, Michael Pecht, Journal of Power Sources, 196(23), pp.10314-10321, 2011.
[2] An Ensemble Model for Predicting the Remaining Useful Performance of Lithium-ion Batteries.
Yinjiao Xing, Eden Ma, Kwok Leung Tsui, Michael Pecht, Microelectronics Reliability, 53(6), pp.811-820, 2013.
Pouch Cells
| Battery (Parameters | Specifications (Value) |
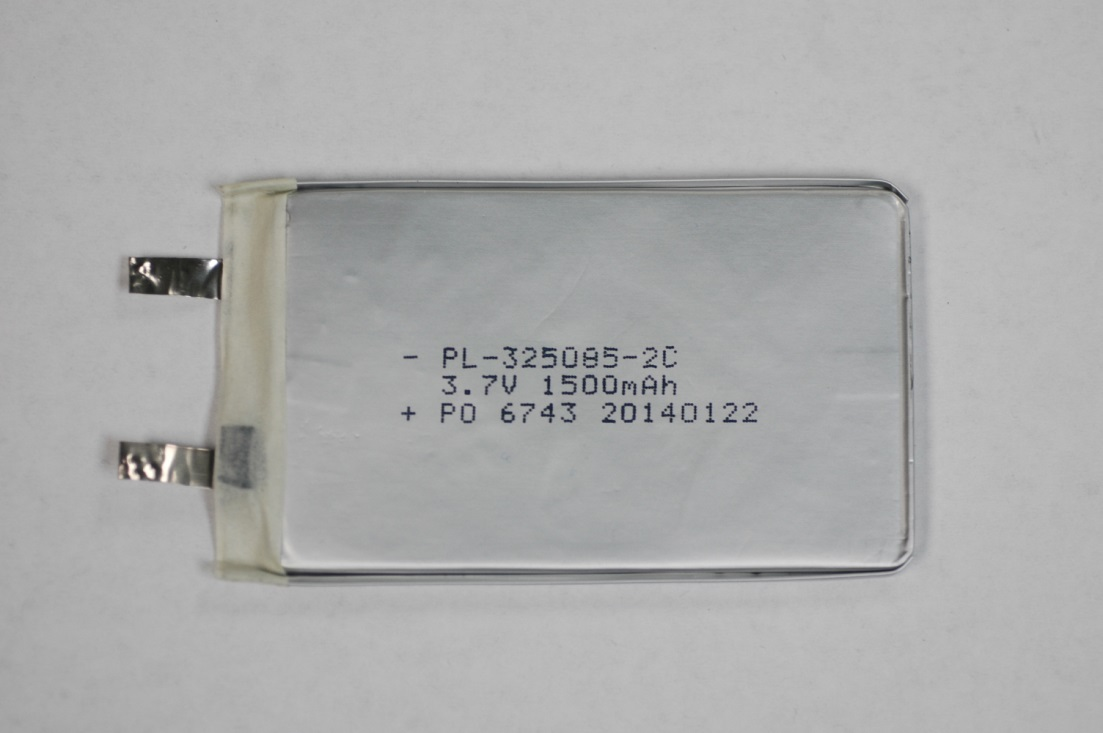
| Capacity Rating | 1500 mAh |
| Cell Chemistry | Graphite/LiCoO2 |
| Weight (without safety circuit) | 30.3 g |
| Dimensions | 3.4 x 84.4 x 50.1 mm |
Cyclic Data and Test Description
Lithium-ion batteries are used for energy storage in a wide array of applications, and do not always undergo full charge and discharge cycling. We conducted an experiment which quantifies the effect of partial charge-discharge cycling on Li-ion battery capacity loss by means of cycling tests conducted on graphite/LiCoO2 pouch cells under different state of charge (SOC) ranges and discharge currents. The results are used to develop a model of capacity fade for batteries under full or partial cycling conditions. This experiment demonstrates that all of the variables studied including mean SOC, change in SOC (ΔSOC) and discharge rate have a significant impact on capacity loss rate during the cycling operation. The initial characterization tests for the cells included constant current constant voltage (CCCV) charge - constant current (CC) full discharge (4.2V - 2.7V) at C/2 rate to determine battery discharge capacity. The test procedure is as follows:
- Cells were initially charged to 100% SOC using the CCCV profile at C/2 rate.
- After reaching 100% SOC, the cells were discharged using constant C/2 current until they reached the lower limits of their assigned SOC ranges (i.e., 20% for 20% - 80% range) for partial cycling.
- Constant current charge (always C/2) and constant current discharge (C/2 or 2C) were applied to the cells for cycling between the desired upper and lower limits of SOC (i.e., 20% - 80%).
- A rest period of 30 min was applied to allow the cells to relax after every charge and discharge steps.
The results highlighted that the graphite/LiCoO2 battery degradation is affected by mean SOC as well as the change in SOC (ΔSOC) during the cycling operation. (Coulomb counting method has been used to calculate the time durations of charge and discharge to maintain the SOC values within designated SOC ranges). The data from the experiment is available for download below:
Cycled between 0%-60% SOC at C/2 rate (0.75 Amp):
| PL 3, 10 |
Cycled between 40%-60% SOC at C/2 rate (0.75 Amp):
| PL 4, 5 |
Cycled between 40%-60% SOC at 2C rate (3 Amp) discharge and at C/2 rate (0.75 Amp) charge:
| PL 9, 25 |
Cycled between 0%-100% SOC at C/2 rate (0.75 Amp):
| PL 11, 13 |
Cycled between 0%-100% SOC at 2C rate (3 Amp) discharge and at C/2 rate (0.75 Amp) charge:
| PL 12, 14 |
Cycled between 20%-80% SOC at 2C rate (3 Amp) discharge and at C/2 rate (0.75 Amp) charge:
| PL 17, 18 |
Cycled between 40%-100% SOC at C/2 rate (0.75 Amp):
| PL 19, 24 |
Cycled between 20%-80% SOC at C/2 rate (0.75 Amp):
| PL 21, 23 |
The above data files have been referenced in:
[1] Cycle Life Testing and Modeling of Graphite/ LiCoO2 cells under different state of charge ranges.
Saurabh Saxena, Christopher Hendricks and Michael Pecht, Journal of Power Sources, 327 (2016), pp.394-400, 2016.
Storage Data and Test Description
A total of 144 Li-ion cells with three different SOC values (0% SOC, 50% SOC and 100% SOC) underwent battery storage life test under four different temperatures (-40°C, -5°C, 25°C, 50°C).
- 12 cells were stored at each of these temperatures: -40°C, -5°C, 25°C and 50°C.
- Of the12 cells stored at each temperature, 4 cells were stored at 50% SOC, 4 cells at 100% SOC, and 4 cells at 0% SOC.
- 48 cells underwent capacity testing and impedance measurement every 3 weeks; 48 cells underwent capacity testing and impedance measurement every 3 months; and 48 cells underwent capacity testing every 6 months.
For example: Cell PLN_51 underwent the initial capacity test with CCCV charging at a rate of C/2. Once the current fell below C/100 rate, the cell was discharged at a rate of C/2 to accumulate the deliverable maximum capacity of the cell. Then, the cell was fully charged using the same CCCV profile followed an impedance test. In the next step, the cell was discharged to 50% SOC through calculating the accumulative capacity to half of the maximum capacity. Further, the cell was stored into the temperature chamber for 3 weeks. After 3 weeks, the cell would be taken out for the capacity and impedance tests.
Initialization - The pre-test initialization data:
| Cell Number, Storage SOC, Temperature and Storage Period |
| Capacity Characterization Initialization |
| Impedance Characterization Initialization |
Capacity - Capacity test for batteries stored at -40°C, -5°C, 25°C and 50°C:
| -40°C | -5°C | 25°C | 50°C |
Impedance - Impedance test for batteries stored at -40°C, -5°C, 25°C and 50°C:
| -40°C | -5°C | 25°C | 50°C |
Top